
The 25th of May, 2021
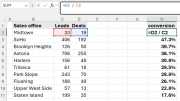
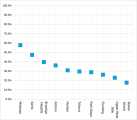
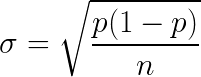
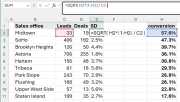
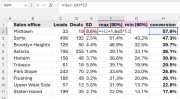
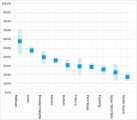
Not all conversion rates are created equal. A 57% rate from 33 leads is not the same as 36% from 706. Ivan Baldin reflects on how to add confidence interval bounds to your sales conversion charts using standard deviation and Excel stock chart candlesticks.
Ctrl ←Apr 1, 2020 · · ·