
Tag: analytics
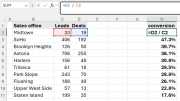
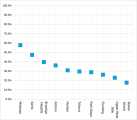
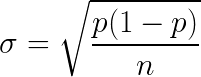
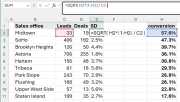
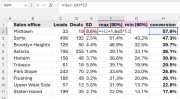
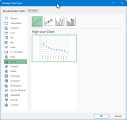
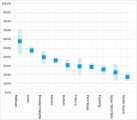
Not all conversion rates are created equal. A 57% rate from 33 leads is not the same as 36% from 706. Ivan Baldin reflects on how to add confidence interval bounds to your sales conversion charts using standard deviation and Excel stock chart candlesticks.
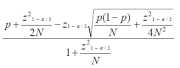
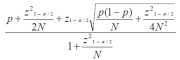
The standard ±1.645 SD approach to binomial distribution confidence intervals breaks down with small samples or extreme proportions. The Wilson score interval, proposed in 1927, handles both cases gracefully. This post walks through a practical call center QA example with formulas and a ready-made calculator.