
Tag: conversion
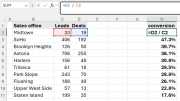
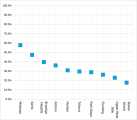
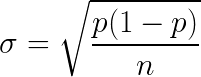
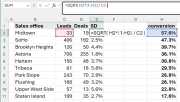
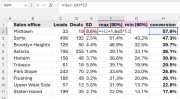
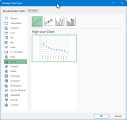
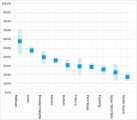
Not all conversion rates are created equal. A 57% rate from 33 leads is not the same as 36% from 706. Ivan Baldin reflects on how to add confidence interval bounds to your sales conversion charts using standard deviation and Excel stock chart candlesticks.
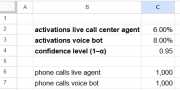
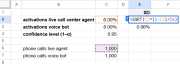
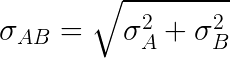
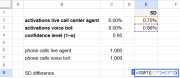
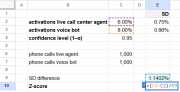
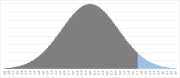

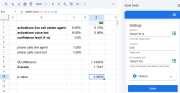
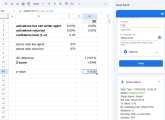
A voice robot beats call center with 8% vs. 6% promo code activations. But how many calls do you actually need to prove the difference is real? We walk through the A/B test math and find the minimum sample size for 95% confidence using Goal Seek in Google Spreadsheets, Z-score and SD.
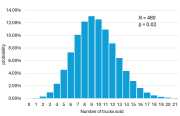

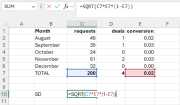
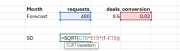
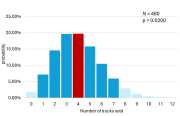
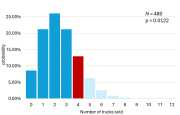
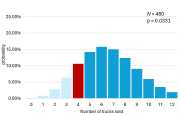
Your conversion rate isn’t a fixed number — it’s a confidence interval. Using binomial distribution, this post shows why a 2% conversion rate on 200 leads could really be anywhere from 0.4% to 3.6%, and why setting sales targets on small samples is madness.