
Here’s a puzzle. Two employees get rated by their clients on a 1-to-5 scale. Their average scores are identical:
Johnson — 5, 5, 5, 5, 5, 2, 2, 2, 2, 2. Average = 3.50.
Miller — 4, 4, 3, 3. Average = 3.50.
A tie. Except — it doesn’t feel like a tie, does it? Johnson has ten ratings, all over the map. Miller has four, tightly clustered. Shouldn’t that matter?
It does. And a fascinating article on EvanMiller.org, “Ranking Items With Star Ratings,” shows exactly how. (Judging by the author’s tone, the whole business of ranking things by ratings is far thornier than it looks, and he keeps coming back to it.)
The core problem is simple: a plain average ignores how many votes went into it. A 4.8 rating from 300 reviews is not the same as a 4.8 from 6 reviews. The first one you can trust. The second one — who knows.
The solution comes from Bayesian statistics (whatever that might mean in this context exactly), et voilà:
Johnson — 2.72
Miller — 2.63
Somehow, either the tighter spread of Miller’s scores (SD of 0.58 vs. 1.58), or the smaller number of ratings (4 vs. 10), or both together refined the average, giving Miller the edge by a few hundredths. The tie is broken.
The formula behind the advanced rating
Brace yourself. It’s gonna sting a little.
We assume there are K possible ratings, indexed by k, where each rating is worth sk points (“1” = 1 point, “2” = 2 points, and so on). Given N total ratings for each item, with nk ratings for each k, we can compute the item’s score using the following formula:
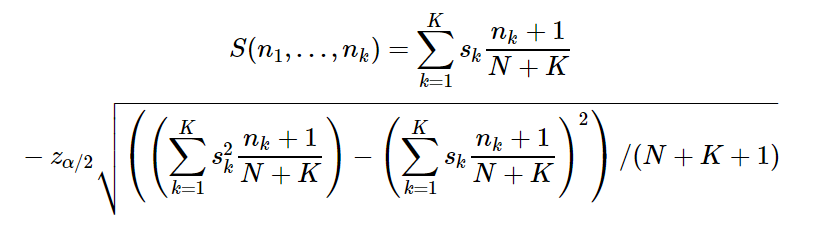
Where zα/2 is the 1−α/2 quantile of the normal distribution. The resulting score is the lower bound of a normal approximation to the Bayesian confidence interval for the average rating. Setting, say, α=0.10 (z=1.65), the score S means that in 95% of cases, the item’s true average rating will be above S.
In plain English: the “advanced” calculation gives you a conservative estimate of what the average rating would converge to if you had more data. And — as we saw with Johnson and Miller — it lets you rank items even when their plain averages are identical.
The advanced rating in action
I took 2,000 ratings on a 1-to-5 scale across a set of regional sales offices and computed both the plain average and the “advanced” score for each one.
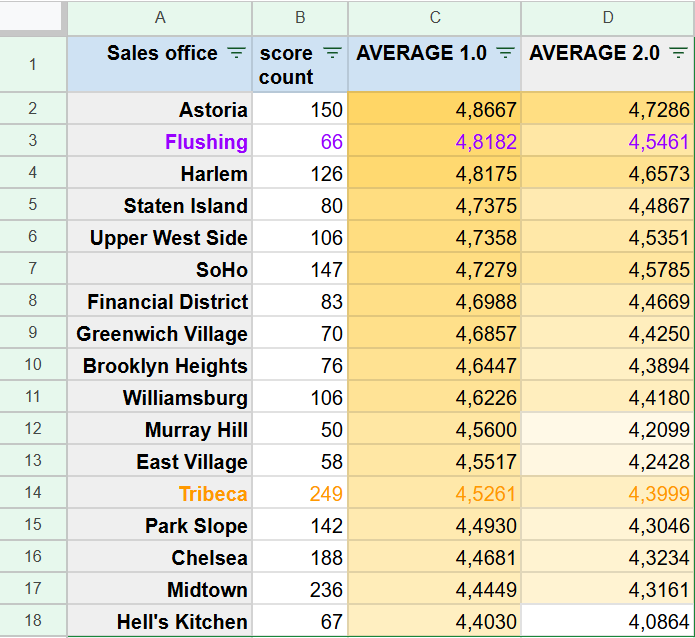
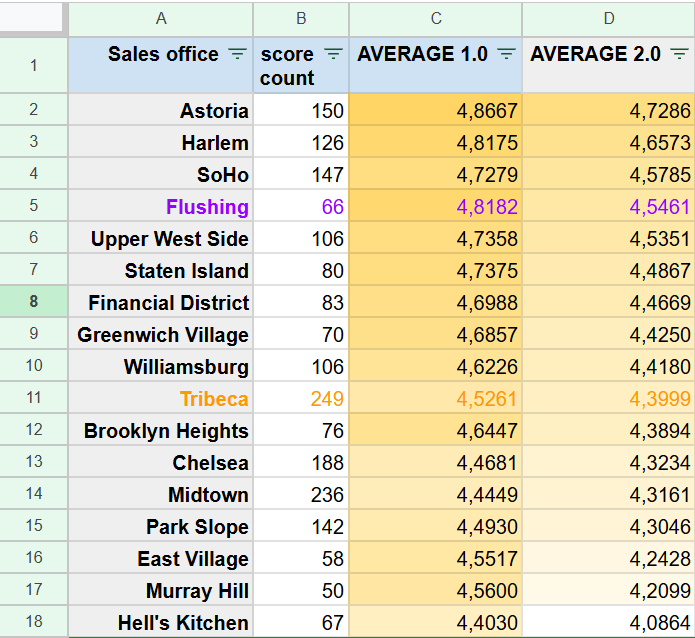
Flushing dropped from 2nd to 4th place. The likely reason: its 66 ratings don’t inspire enough confidence that the average is truly that high. In 90% of scenarios, its predicted rating is no better than 4.55 — roughly 4th place territory.
Tribeca, on the other hand, was formally 13th. But thanks to a solid base of 249 ratings, the model predicts — with 90% confidence — an average of at least 4.4, which bumps it up to 10th.
My impression is that the formula works most convincingly for short rating scales, like the 1-to-5 used here.
In any case, here is a Google Sheets workbook — it should handle rating scales up to 100, import up to 10,000 rows of individual ratings, and lets you adjust the confidence level (90% in our example).
See also
https://www.evanmiller.org/ranking-items-with-star-ratings.html
Advanced rating calculator in Google Sheets