
Tag: Google Sheets
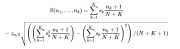


Two employees, same average rating — but should we trust 10 scattered scores the same as 4 consistent ones? Inspired by Evan Miller’s work on ranking items with star ratings, this post walks through a Bayesian approach that accounts for both spread and sample size.

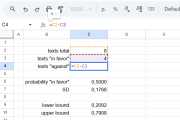
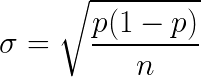
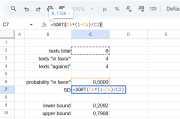
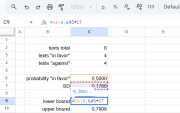
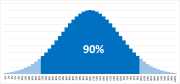
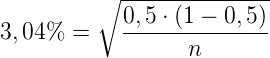
A radio host saw 4 listener texts for and 4 against, and called the audience evenly split. The math says otherwise: on a sample of 8, the true share is anywhere from 21% to 79%. Here’s how to compute that – and why you’d need 271 texts.
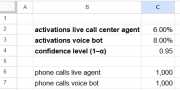
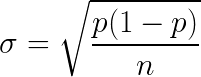

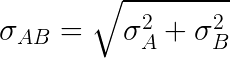


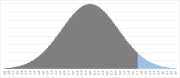


A voice robot beats call center with 8% vs. 6% promo code activations. But how many calls do you actually need to prove the difference is real? We walk through the A/B test math and find the minimum sample size for 95% confidence using Goal Seek in Google Spreadsheets, Z-score and SD.