
Here’s another case. The middle of a busy day in the sales department, and the phone has been silent for half an hour.
There are two possibilities: either something is broken, or this is just a lull that happened to run long, and the next customer call is about to come in.
Let’s work out how many minutes you can sit in silence before you should start to worry.
The least obvious parameter of a phone call
What parameters does a phone call in a sales department or a call center actually have? Date and time, speed of answer, duration, day of the week, line number, customer number – those are the obvious characteristics you can analyze incoming calls by.
One more hides in the shadows: the length of the pause (the stretch of time with no calls) that came right before the call. Say a call came in at 2:07 p.m. on February 13 and lasted 3 minutes 52 seconds. That’s what you see in an export, in the PBX logs, or in the CRM. What is no less interesting: if the previous call was logged at 2:01 p.m., then that six-minute gap is exactly the non-obvious parameter that could be analyzed too.
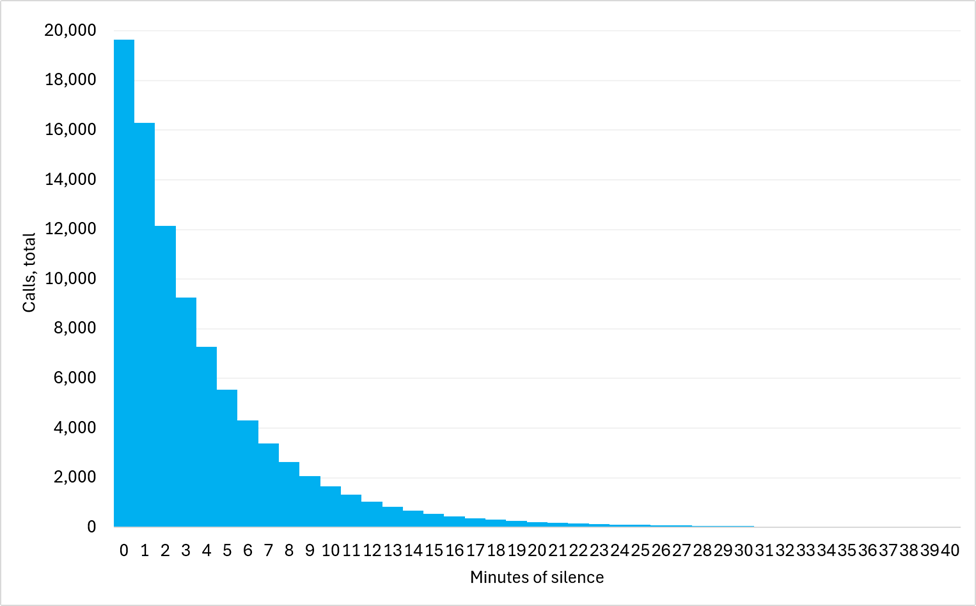
Let’s take calls to a call center on weekdays between 10 a.m. and 7 p.m. We compute the difference in minutes between two adjacent calls – “0” if less than a minute passed, “1” for one to two minutes (from 01:00 to 01:59), and so on. Analyze thousands of calls, and you get roughly this table:
| Pause before the call, minutes | Number of calls | Share of calls | Cumulative share |
| 0 | 19,641 | 21.3% | 21.3% |
| 1 | 16,299 | 17.7% | 39.0% |
| 2 | 12,137 | 13.2% | 52.2% |
| 3 | 9,251 | 10.0% | 62.2% |
| 4 | 7,276 | 7.9% | 70.1% |
| ... | ... | ... | ... |
| 23 | 139 | 0.2% | 99.4% |
| ... | ... | ... | ... |
| 40 | 10 | 0.0% | 100.0% |
(Strictly speaking, pauses longer than 40 minutes occur as well, but their share is vanishingly small – which is why, rounding to the nearest tenth, we already reach 100% at 40 minutes.)
The simple idea of “anomalous” pauses
So we now have a remarkably clean histogram of how pause lengths are distributed. What stands out is that they decay exponentially:
Let’s come back to what we set out to calculate in the first place.
The idea we started with: sooner or later, a gap between calls in the middle of the workday grows so long that it starts to worry the managers. It stands to reason that the length that triggers the worry is different in every sales department and every call center – for a large call center, a five-minute gap is already very unlikely; for another, five minutes is the standard interval between calls, but 55 minutes is genuinely suspicious.
What if we frame the idea of an “anomalously” long pause this way: it is a pause that occurs extremely rarely – say, once a week, or once a month, or once every six months. We pick the level of “anomaly” that seems reasonable to us, and then work out which pause lengths occur about as rarely as our definition says.
For example, let an anomalous pause be one that, on average, happens once a week.
If the calls in our table cover the past year, then the number of “anomalous” (“once a week”) pauses in it should be on the order of 52 – one for each week.
So we need to count off the 52 calls with the longest pauses before them. In my table there turned out to be 47 calls with pauses of 38 minutes or more, and after that 57 calls with pauses of 37 minutes or more.
Which leads to the conclusion that a 37- to 38-minute gap between calls on a weekday should put you on alert: either you are looking at the weekly “anomaly,” the one that shows up about 52 times a year, or a technical failure has occurred and the calls have stopped coming in.