
A contractor swears the phones drop out on every fifth call. You make one — it’s fine. Another — also fine. How many do you need before you can confidently tell him he’s wrong?
Our job is to check whether the claim that 20% of calls have connection problems holds up. And as always, we’re not going to just make 100 test calls — we don’t have the resources for that. Instead, we’ll state a null hypothesis, an alternative hypothesis, and test it at a chosen confidence level.
Stating the hypothesis and choosing a confidence level
The null hypothesis (H0) is the contractor’s claim: at least 20% of calls have connection problems. This is the claim we’re putting on trial.
The alternative hypothesis (H1) is that the connection is fine — problems happen in fewer than 20% of calls. This is the position we’ll lean toward if the data supports it.
(That framing matters. In hypothesis testing, you never “prove” H0; you either reject it or you fail to reject it. So when we say we want to side with the contractor or not, what we really mean is: can we gather enough evidence to reject his claim?)
The confidence level is how sure we want to be about the outcome. The higher it is, the more test calls we’ll need to make, so we’ll budget 1% for error and go with 99% confidence — leaving a 1% chance that we reject the contractor’s claim when problems really are there.
Building the formula for the sample size
To reject H0, all we need is to pull off N successful calls in a row with no signs of trouble — while keeping the probability at or below 1% that we simply got lucky and that real equipment problems just happened not to show up in any of the N calls.
If the contractor is right, 80% of calls go through cleanly. The probability of no issues across N calls in a row is 0.80N. We need the smallest N for which that probability drops to 1%:
0.80N = 0.01
Which is exactly the logarithm of 1% to base 80%.

Into Google Sheets it goes:
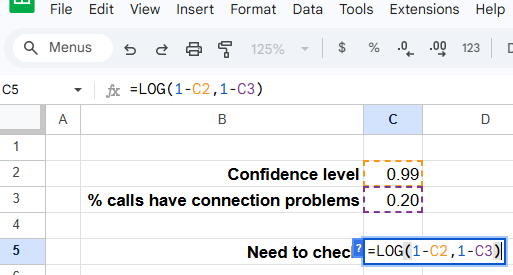
The formula for cell C5 looks like
=LOG(1-C2,1-C3)We need 20.64 calls. (Check: 0.8020.64 = 0.9995%, right on target.)
All that’s left is rounding up:
=ROUNDUP(C5)or, in one shot,
=ROUNDUP(LOG(1-C2,1-C3))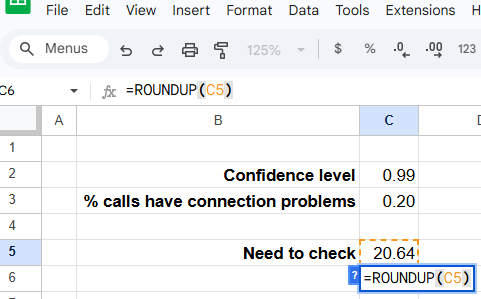
Testing the hypothesis
If the contractor’s claim H0 is correct and every fifth call really does have trouble, then the probability of seeing zero problems across 21 test calls in a row is about 1%. In other words: either we just hit a one-in-a-hundred coincidence, or the claim that 20% of calls have problems doesn’t hold. At the 99% confidence level, we reject H0 — in everyday terms, the connection is fine.