
In the article “Case Study: On Black Friday, KupiVIP Replaced Their Call Center with a Robot, and Only 5 Out of 5,000 People Realized They Were Talking to a Neural Network” on vc.ru, one phrase caught my attention above all else — the part where the author mentions a conversion rate increase from 6% to 8%:
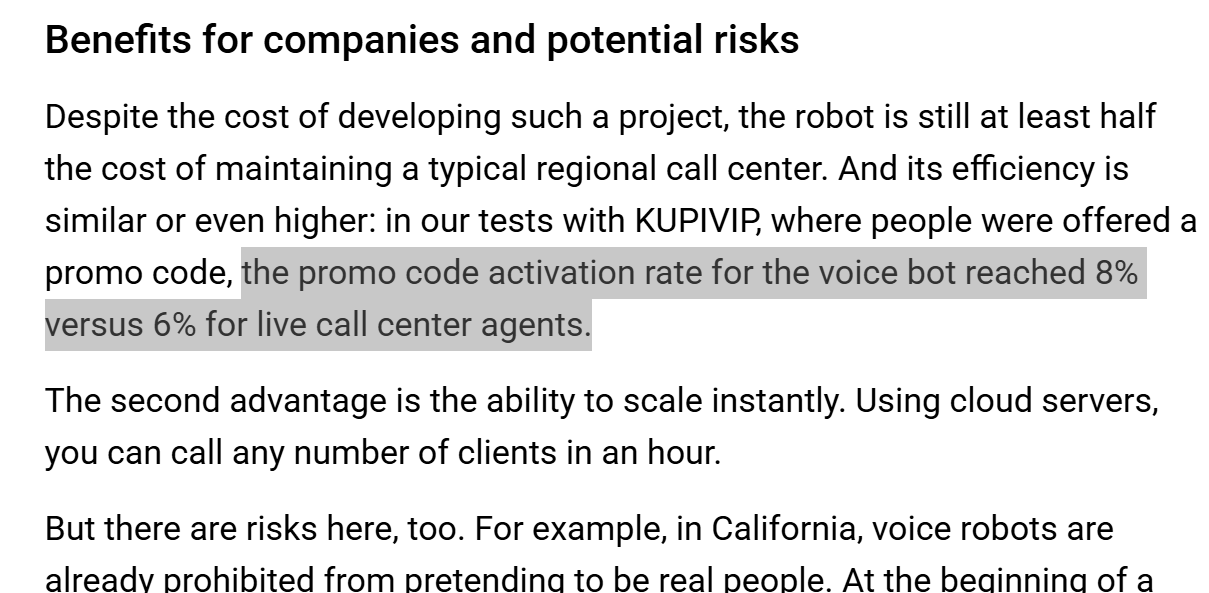
Naturally, I started wondering: on what call volume was this conversion rate increase observed, and was that volume sufficient to make a reliable claim that the voice robot outperforms live call center agents?
The question can be formulated precisely as follows: what is the minimum number of calls required to claim, with a confidence level of, say, 95%, that the conversion rate “increased from 6% to 8%”?
Building the Experiment in Google Spreadsheets
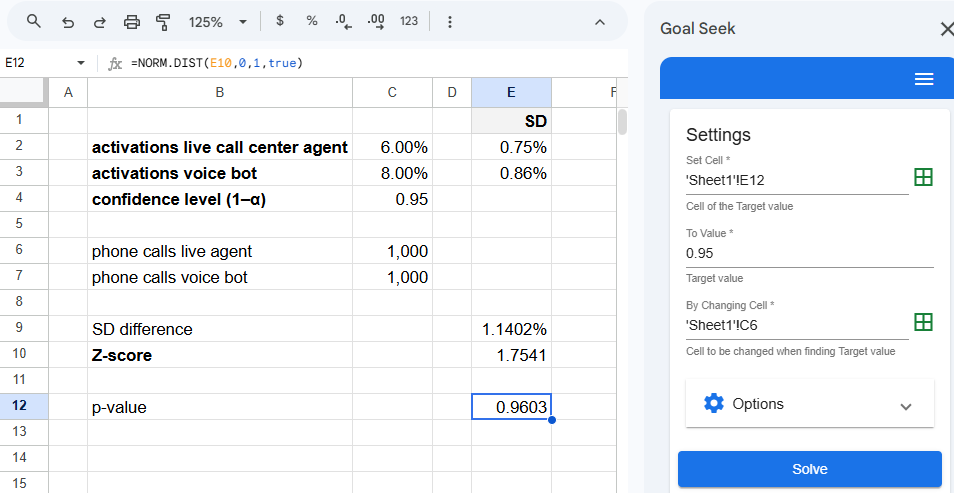
Let’s lay out the available data in Google Spreadsheets. For the calculations that follow, we’ll need a “number of calls” parameter — let’s assume for now that both the robot and live agents each made 1,000 calls before the 6% and 8% conversion rates were obtained:
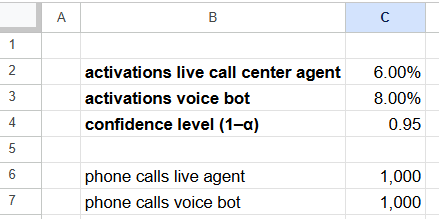
Essentially, this is a standard A/B split test, and we’ll need to walk through its algorithm to obtain the Z-score and calculate the p-value.
Let’s calculate the standard errors (SD, or σ) for both conversion rates, along with the standard error of the difference between them. The formula for the standard error of a conversion rate:
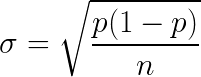
where p is the conversion rate (6%, for example) and n is the sample size (1,000 calls). Here’s the Google Spreadsheets calculation:
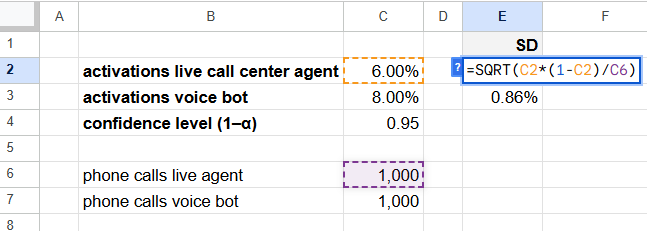
The standard error of the difference between conversion rates is calculated using the formula:
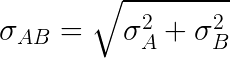
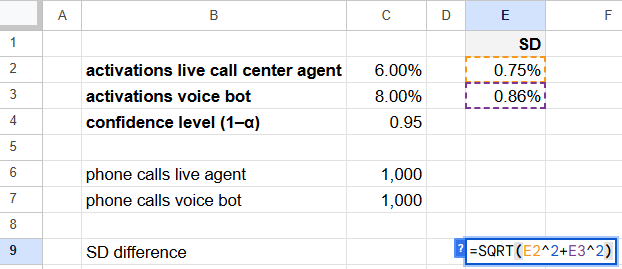
where σ is the standard error of each conversion rate, A and B (live agent and robot). We’ll compute it just below in Google Spreadsheets:
How much larger is the difference between conversions A and B compared to the standard error of that difference? This ratio is called the Z-score. In Google Spreadsheets, it’s straightforward:
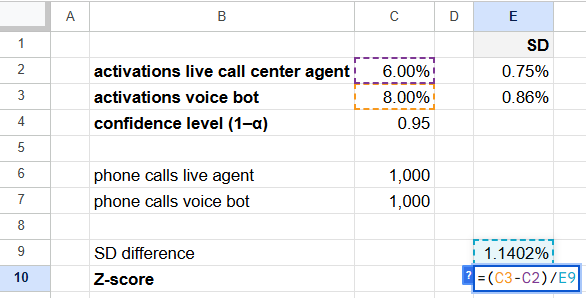
So the Z-score = 1.7541. On the normal distribution curve, this corresponds to the 96th percentile — meaning the probability of the Z-score randomly exceeding 1.7541 is about 4% (in other words, 96% of the area under the bell curve falls within +1.7541 standard deviations):
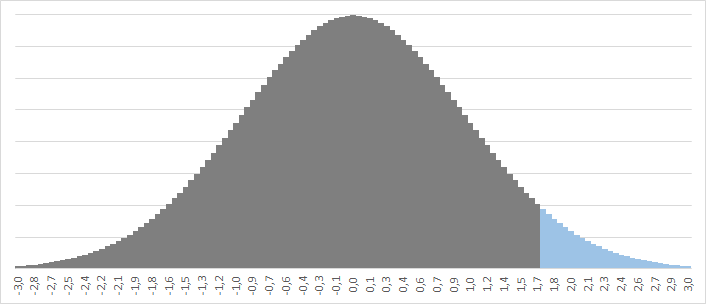
Where did we get 96%? The exact probability, the p-value, is calculated using the formula:
=NORM.DIST(1.7541,0,1,TRUE)
P-value = 96.03%.
So here’s our interim conclusion: if, on a sample of 1,000 calls in each of the two groups, we observed conversion rates (promo code activations) of 6% and 8%, then we are 96% confident that this difference is not due to chance. (There remains a 4% probability that the observed difference is random. In that case, perhaps the conversion rate is actually the same — say, 7% — and had we made more calls, the difference would have eventually disappeared.)
Minimum Experiment Size
Now, let’s get back to the original question.
We weren’t trying to prove that 8% is greater than 6%, and the figure of 1,000 calls for the robot and agents was chosen arbitrarily. What we wanted to calculate was the minimum number of calls needed to establish the statistical significance of the difference between 8% and 6% at a 95% confidence level.
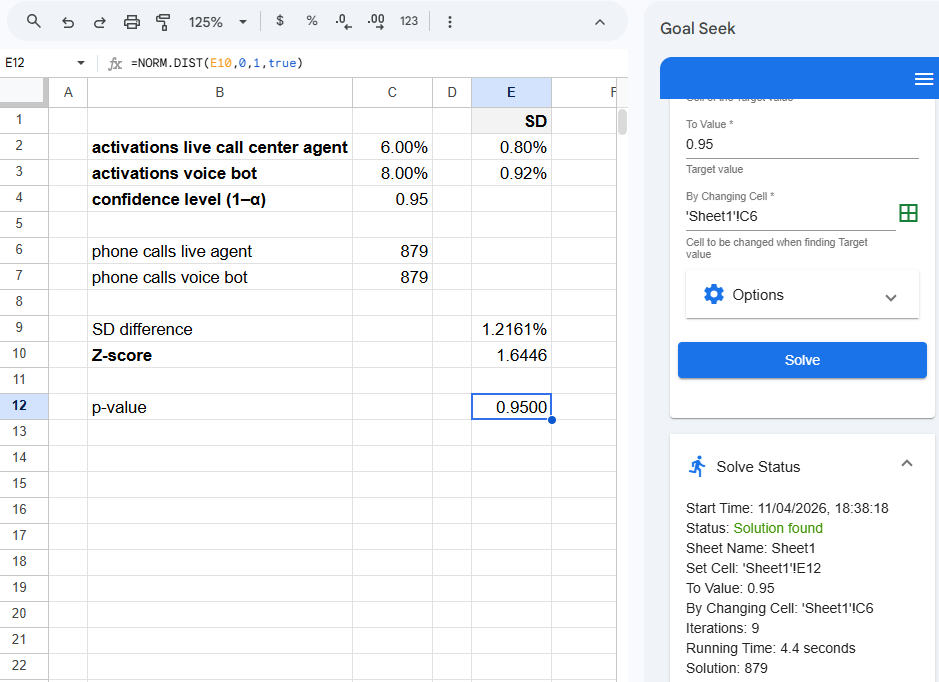
1,000 calls turned out to be more than enough. Now we just need to decrease this number until the p-value crosses the 95% threshold. (By the way, according to the normal distribution formula, this corresponds to a Z-score of 1.6449 — try verifying this yourself.)
In theory, it would probably be possible to derive a large formula for the n at which the p-value equals 0.95. In practice, it’s faster to manually find the minimum n through trial and error. Or, better yet, install a Goal Seek add-on for Google Spreadsheets and use it to find the answer automatically:
Conclusions
So, we’ve calculated the minimum experiment conditions for evaluating the effectiveness of the KupiVIP voice robot.
You need at least 879 calls in each of the two groups to confirm, with a 95% confidence level, that there is a difference between the 6% promo code activation rate in the control group (real live agents) and the 8% rate in the test group (voice robot).
(The only caveat is that neither 6% nor 8% yields a whole number of activations on a sample of 879 calls, and in reality, of course, the numbers would be different — and the number of calls in the two groups could vary as well. But this doesn’t really matter much, since the conversion rates cited in the article were most likely rounded.)