
A curious thing about working with the concept of conversion rate is that, strictly speaking, a conversion rate is almost never precisely defined.
All those “call-to-sale conversion of 18.4%,” “CTR of 3.1%,” “deal conversion of 30%” — it’s always a somewhat simplified approach, as if the conversion rate were reliably measured and, should it change, we’d explain it with objective factors, never entertaining the thought that there never was any “18.4%” to begin with — there were just 38 contracts we closed on 206 calls, and that doesn’t at all mean there couldn’t have been more or fewer.
Much like the position of an electron around the nucleus of an atom isn’t defined by exact coordinates, but is merely described by a region where it’s most likely to be found, our conversion rate is not a specific number either. In reality, it is an interval within which it lies.
Calculating Conversion Rates and Cognitive Bias
Consider a fictional sales department that started selling a new product this year. Let’s say, hmm, trucks. The product isn’t in high demand, so, for now, there isn’t much data for analysis — or, better said, very little at all:
| Month | Leads | Sales |
| August | 48 | 1 |
| September | 35 | 1 |
| October | 24 | 0 |
| November | 61 | 2 |
| December | 32 | 0 |
| TOTAL: | 200 | 4 |
As the sales data shows, over several months we’ve got 4 deals out of 200 leads, i.e. our conversion rate is 4 / 200 = 2.0%.
(Additionally, based on five months of data, we can roughly project 480 leads for the next year and, accordingly, 480 × 0.02 = 9.6 deals.)
Given such scarce data, it’s impossible to go wrong, so, of course, such a forecast won’t be incorrect. However, it contains an important cognitive bias: 2.0% is not the exact value, but rather the most probable so far value of our lead-to-sale conversion rate for trucks.
In reality, the conversion rate cannot be determined precisely. It lies within a confidence interval from 0.4% to 3.6%. And for the coming year, we should be projecting not 9.6 deals, but somewhere between 5 and 15 trucks sold. Unfortunately, narrowing this range any further would be overly optimistic.
The Conversion Bell Curve
Assuming that our true conversion rate is stable and exactly equals 2.0%, we can estimate the possible range of deals out of 480 leads expected next year. Since we can only vouch for the consistency of our own work but can’t account for randomness (customer moods, force majeure, a lucky sale to the CEO’s buddy), there’s always a chance the number of deals will differ slightly from the projected 480 × 0.02 = 9.6 deals — much like the number of tails in 480 coin flips may differ slightly from 240, coming out to 235, 248, or possibly even 223.
Graphically, this looks like a normal distribution bell curve, where the further we move from the expected value of 9 deals at the center of the bell, the lower the probability of closing significantly fewer or significantly more deals:
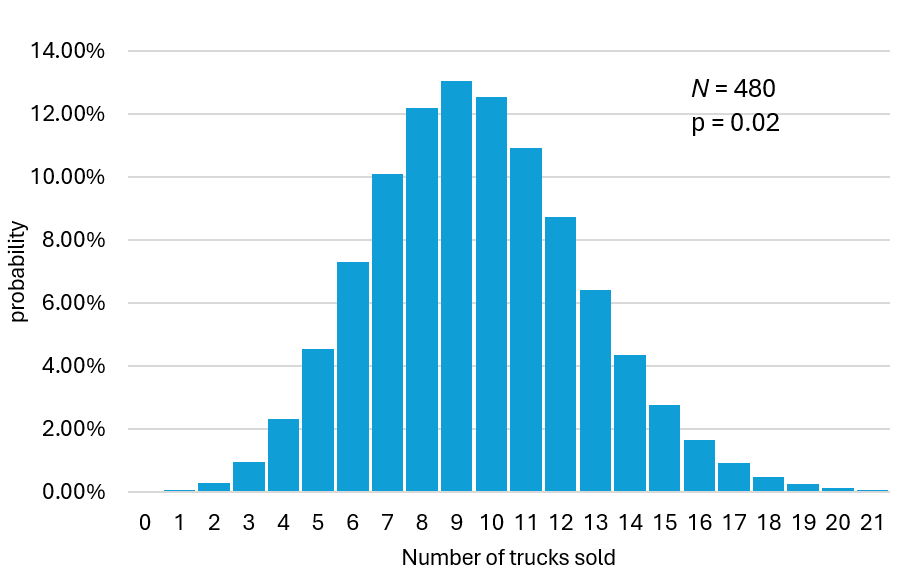
Looking at the resulting graph, we have to admit that seeing fewer than 2 or more than 19 sales is practically impossible.
But can we narrow our confidence interval?
Confidence Interval of a Conversion Rate
The standard error (SD) for a binomial distribution is calculated using the formula:

where n is the number of trials, and p is the probability of success.
For our 200 leads this year, we get:
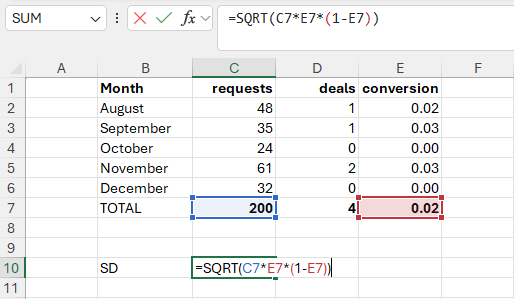
SD = 1.98 deals. In other words, according to the laws of normal distribution (and binomial distribution is a special case of normal distribution), in roughly 68% of cases, while operating with a true conversion rate of 2.0%, we’d land within the confidence interval of 2.02 to 5.98 deals, i.e. ±1SD.
For the projected 480 leads next year, we get:
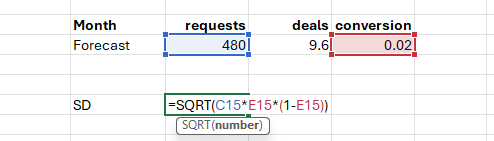
SD = 3.07 deals. By the laws of binomial (normal) distribution, it is known that in 68% of cases, next year’s sales will fall within ±1SD of the expected value of 9.6 deals, and in 90% of cases — within ±1.645SD of the expected value. 3.07 deals × 1.645 = 5.05 deals, meaning that in 90% of cases, if we work the entire next year at a 2% conversion rate, we won’t fall outside the confidence interval of “4.55 to 14.65 deals.” (Notably, conversely, in 1 out of 10 cases we will fall outside these bounds, all while still operating at a “true” conversion rate of 2%.)
One can only wonder what kind of uproar the sales manager would raise if, by year’s end, we sold just 4 trucks on 480 leads, formally showing a conversion rate of 0.83%... and what’s even more curious is that, statistically, this happens in 1 out of 27 sales departments.
In one out of 27 cases, you get fired for missing your sales target, even though you were still operating at a “true” conversion rate of 2%.
Three Conversion Rates at the Confidence Interval Boundary
So how should we interpret this year’s results, where we got 4 sales out of 200 leads?
Case one, “2.00%.” We covered this one right away. 4 / 200 = 0.02, meaning our conversion rate is 2%. At the same time, by the laws of binomial distribution, there’s still a chance of fluctuating within the 90% confidence interval of “±1.645SD,” i.e. within the range of 0.74 to 7.26 deals per 200 leads.
It looks roughly like this:
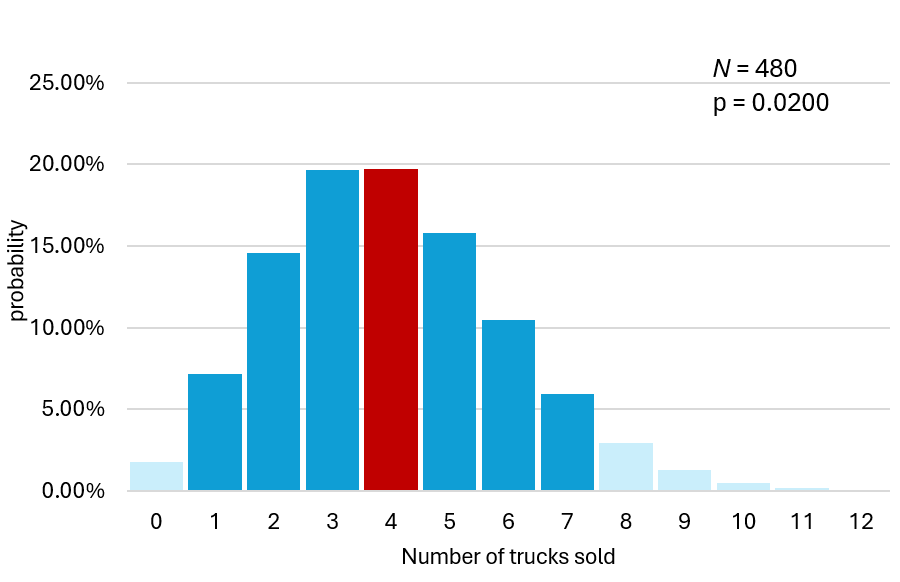
Our result of 4 deals matched the expected value for a 2.0% conversion rate, although, in general, it didn’t have to — it could have landed anywhere within the 90% confidence interval of 1 to 7 sales.
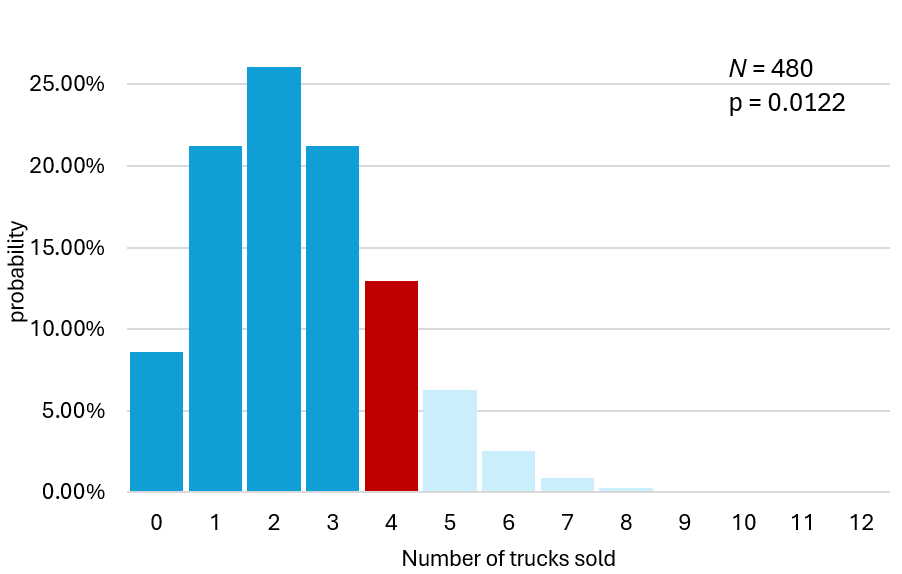
Case two, “1.22%.” In this scenario, our “true” conversion rate is actually lower, equaling, say, 1.22%. Then the expected number of trucks sold is approximately 2, and we were lucky to close 4 sales. Our luck was such that we could have made more than 4 sales only in 10% of cases. That is, we remain within the 90% probability field, though we’re sitting at its boundary. A little more, and our luck would be too good — but for now, we’re lucky “within reason”:
Case three, “3.31%.” Now let’s suppose that this year we were unlucky, even though our true conversion rate was above 2.0% all year and actually equaled 3.31%. The expected value for 200 leads would then be approximately 6 trucks sold, and making fewer than 4 sales would only be possible in 10% of cases. So we’d still be within the 90% probability field, but sitting at the left boundary with our unlucky 4 deals.
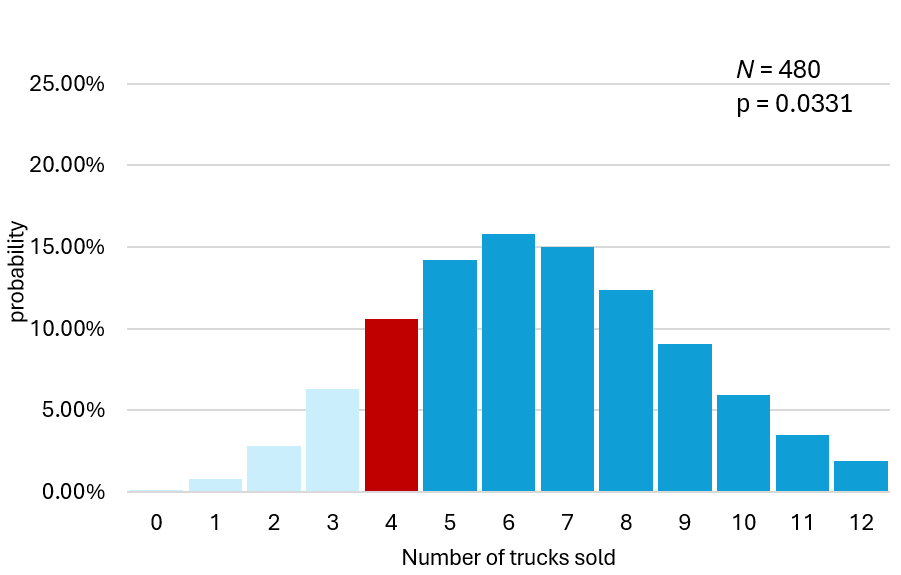
Thus, the takeaway is clear: we don’t know for sure which of the 3 conversion rates is the true one. We’re used to thinking it’s Case 1 — dividing 4 sales by 200 leads and getting a conversion rate of 2.00%. But nobody knows for certain whether the current year was typical or atypical, whether we were lucky or unlucky. In 90% of cases, it could have been a matter of luck, and we were actually operating at a conversion rate of 1.22%, or a matter of bad luck, where we were operating at a conversion rate of 3.31%. In all 3 cases, the probability of closing 4 sales out of 200 leads did not exceed the 90% threshold.
Unfortunately, we simply don’t have enough data yet to make more precise claims.
We Need More Data
A logical question to ask is — how much data do we need to accumulate before we can speak of a 2.0% conversion rate with any reliability? Let’s try gradually increasing the sample size (number of leads, and consequently, sales) until we see the 90% confidence interval converge around the 2.00% conversion rate value:
| Leads | Deals | Lower bound of 90% confidence interval (-1.645SD) | Upper bound of 90% confidence interval (+1.645SD) | Lower conversion bound | Upper conversion bound |
| 200 | 4 | 0.7 | 7.3 | 0.37% | 3.63% |
| 500 | 10 | 4.9 | 15.1 | 0.97% | 3.03% |
| 1,000 | 20 | 12.7 | 27.3 | 1.27% | 2.73% |
| 5,000 | 100 | 83.7 | 116.3 | 1.67% | 2.33% |
| 10,000 | 200 | 177.0 | 223.0 | 1.77% | 2.23% |
| 50,000 | 1,000 | 948.5 | 1,051.5 | 1.90% | 2.10% |
| 100,000 | 2,000 | 1,927.2 | 2,072.8 | 1.93% | 2.07% |
| 500,000 | 10,000 | 9,837.2 | 10,162.8 | 1.97% | 2.03% |
| 1,000,000 | 20,000 | 19,769.7 | 20,230.3 | 1.98% | 2.02% |
| 10,000,000 | 200,000 | 199,271.7 | 200,728.3 | 1.99% | 2.01% |
| 25,000,000 | 500,000 | 498,848.5 | 501,151.5 | 2.00% | 2.00% |
Needless to say, very few sales departments can generate more than a few tens of thousands of leads. Therefore, the truth is, setting sales targets and making promoting and firing decisions based on 1–5% conversion rates is madness — at these small numbers, math in sales simply doesn’t work.